Product Development
Computational Fluid Dynamics (CFD) is a fun/engineering software used to simulate and solve real life/complex engineering problems that cannot be solved by general human approaches. CFD helps optimize the design and uses numerical approach to solve problems involving fluid flow. It is also used to predict performance of new design and new software.
CFD is used in a vast number of industries especially industries that require analysis of fluid flow. Some industrial applications of CFD include:
- Pharmaceutical Companies: The pharmaceutical company uses CFD to analyze drug behaviour in the body and bodily response to each drug.

The figure above shows the respiratory tract of the human body. As shown in the figure, the trachea has a high resistance with a low change in air volume while the bronchi has a low/negligible resistance (ANSYS, 2015). What this really means is that the bronchi is more susceptible to diffusion of a drug into the lungs because the lungs receive air from the bronchi. For example, if an inhaler is used, the content of the inhaler passes through the trachea to the bronchi and straight into the lungs, hence clearing of the airway and lungs results in a cured individual. CFD is very useful in this case because it simulates drug behaviour which results in a more effective and efficient way of curing an individual and in turn avoids further complications.
- Food industry: The food industry uses CFD in a vast number of ways. CFD is used to analyze way of achieving maximum mixing, effective sterilization, and optimum drying.
CFD is used to maximize mixing scenarios. To achieve maximum mixing the use of impellers and agitators could be implemented. Figure 2 shows the velocity field of food components being mixed together with the use of an agitator. Other mixing examples could implement a twin screwed agitation to optimize mixing.

With CFD it is possible to study temperature distribution over a food component when sterilising food and also flow pattern to optimize the quality of food product. This results in a better quality of food produced (Xia, 2002). Lastly, CFD is used to optimize the rate of drying and achieve a dried food product at a faster rate. It is important to note that to optimize drying, air velocity and contact area plays a crucial role.
- Chemical Industries: CFD is used in number of chemical industries from oil and gas to reactor design etc. In the oil and gas companies, CFD is used to model fluid flow, equipment behaviour in fluids, fluids in pipleline etc. CFD is also used to simulate new reactor design, best composite material for reactions, optimize reactions, reactor performance, and reactions in the reactor. CFD is also used to model fluid flow when things like baffle and other equipments are implemented into the system.
- Other applications of CFD are in aerospace industries for innovative ways to support new designs, fuel efficiency etc. This shows that CFD is used in a number of industries.
Advantages of CFD
- Provides understanding of Fluid flow
- With CFD, the effect of physical properties like temperature and pressure can be properly analyzed
- CFD is a cost-effective way of simulating real-life flow problems.
- It is used to analyze new systems and answers geometrical questions
Project – Evaporation of n-heptane
For this project, I designed and optimized the system for the best configuration for the removal of n-heptane from the system.
n-heptane is located at the top of each box as shown in the figure below. The figure below shows optimum configuration for the removal of n-heptane at a velocity of 2m/s.
Strategy for 2m/s
- Understand fluid flow and how boxes affect fluid movement.
- Utilizing air velocity so mass transfer by convection dominates the evaporation process.
- Utilize surface area of the boxes/contact area between the box and air.
Commentary: This strategy was achieved by moving boxes in such a way that the do not restrict the flow of air into the system, but was placed in a way that air velocity and surface area of the boxes came in maximum contact. The inlet that shows a maximum contact with both air and the boxes (Heptane) would be used for drying of heptane.
During this simulation, the blocks were positioned on different intervals in the system. Middle, close to the outlet and then close to the inlet. It was found that the inlet has the best evaporation rate. Using both the pressure of air coming into the system to maximize evaporation.
Discussion for 2 m/s
Using 2m/s the Reynolds number was calculated to be in turbulent flow. Mass is transferred from the surface of heptane to the bulk of air for drying to occur. For Reynolds number in turbulent flow, mass transfer by convection dominates this drying process.
The initial configuration of the boxes as shown in figure .. was used to run the first trial, resulting in low mass fraction of heptane leaving the system. Next, the boxes were aligned horizontally in a straight line with inlet 3 open. This resulted in air velocity in contact with the first box and then leaving the system. Air velocity did not come in contact with the three boxes aligned behind the first box. Next, the boxes were aligned vertically in a straight line using all 4 inlets to run several trials. When compared with the horizontal alignment, the vertical alignment having spaces between the boxes had more heptane leaving the duct, but multiple occurrence of reverse flow was a major problem with box configuration farther away from the inlet. Reverse flow did affect the amount of heptane leaving the system. To avoid reverse flow, the boxes were moved closer to the inlet.
With the idea of utilizing contact area and air-velocity, the boxes were utilized in such a way that mass transfer by convection dominates drying of heptane. The boxes were then moved closer to the inlet and spaced out evenly utilizing maximum possible surface area of the boxes. Thus, there is an improved rate of drying when there is more exposed surface area of the box. More contact with air and heptane leads to a faster rate of drying.
The initial angle of the boxes was at 35°. The boxes were then oriented in a 45° angle to maximize the contact area between air and heptane. Inlet 1 was opened and air-velocity came in straight on the x-axis. Maximum air-velocity came in contact with the first box and the other three boxes did not come in maximum possible contact with air. Afterwards, the inlet air velocity was angled at 45° downwards. This resulted in maximum possible contact with only the three boxes below. The first box did not have much contact with air. Subsequently, inlet 2 was opened, resulting in figure 4 displayed below.
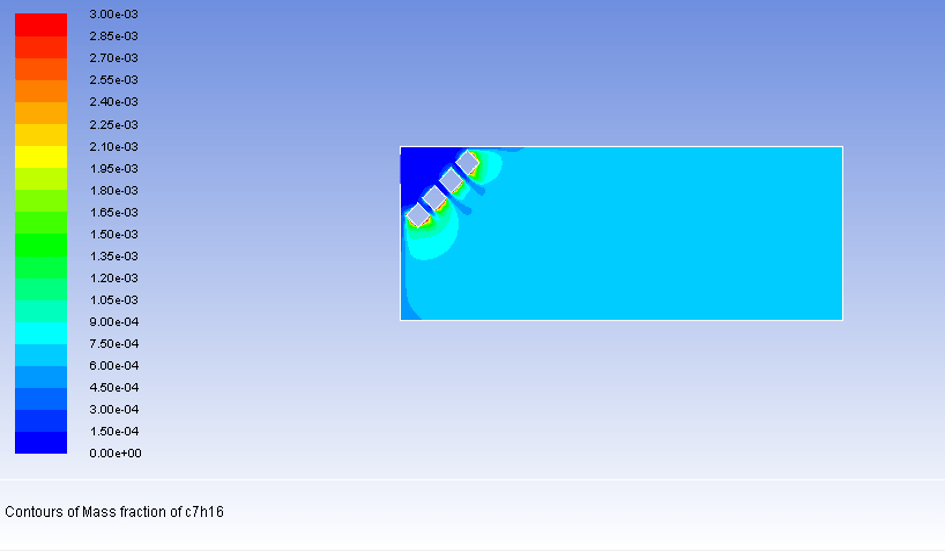
Figure 3: Mass fraction of heptane in the duct (best configuration 1). The figure above shows the mass fraction of heptane in the system. This figure shows the best configuration when considering only inlet 1 and 2.
Inlet 2 has an air velocity coming into the system at 2m/s. The boxes at 45° angle utilizes contact area of the heptane and air. Therefore it is safe to assume that there is maximum possible contact between the air velocity and the boxes in the duct. As shown in figure 3, as air comes into the duct, it uses mass transfer by convection to enhance drying. The deep blue colour in figure 3 shows air coming into system as air hits the boxes, it causes heptane to be spread out into the duct making the box to get dry at a faster rate.

Figure 4: Velocity vector of air coming into the duct using inlet 2
The air velocity as shown in figure 4 is being utilized to achieve maximum evaporation of heptane in the duct. Due to high velocity, mass transfer by convection dominates the drying process.
Using the same strategy, inlet 3 was used. The boxes were placed around the inlet and the box angle was changed from 45°angle to a 90°. Further adjustments were made to ensure a decent amount of space between the boxes, ensuring a maximum mass of heptane being evaporated from the duct.
Inlet 3 with a distance at 7.5m was used to run the trail shown in figure 5. Air- velocity is coming into the duct in the x-axis. Inlet 3 was more effective at removing heptane from the duct.
Commentary: It is important to note that as more air comes into the system, less fraction of heptane leaves the system but that does not necessarily mean there is a smaller amount of heptane leaving the system. The mass of what’s coming into the system is multiplied by the mass fraction of heptane leaving the system resulting in a total mass of heptane leaving the system.
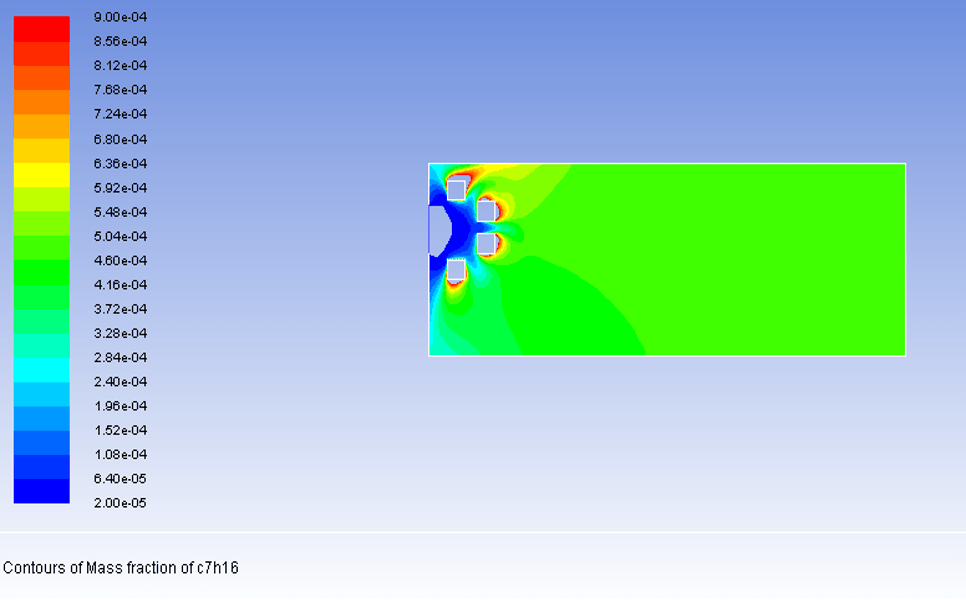
Figure 5: Mass fraction of heptane in the duct (best configuration 2). The figure above shows the mass fraction of heptane in the system. This figure shows the best configuration when considering for all inlet.

Figure 6: Velocity vector of air coming into the duct using inlet 3. Air velocity used to achieve maximum evaporation of heptane in the duct.
Results
The average temperature of the system was used for all calculations listed below. Reynolds number was used to determine the flux of heptane on the boxes.
Average temperature: 23.3°C
Reynolds number: 15865
Diffusivity: 1.810×10⁻⁷m/s
To calculate the polynomial of diffusivity, viscosity and thermal conductivity the equation
| A | BT | CT | |
| Diffusivity | 1.818 × 10⁻⁷ | 6.136 × 10⁻¹⁰ | 2.071× 10⁻¹² |
| Thermal Conductivity | 0.0454 | 1.532 × 10⁻⁴ | 5.171× 10⁻⁷ |
| Viscosity | 1.72× 10⁻⁵ | 5.805 × 10⁻⁸ | 1.959× 10⁻¹⁰ |
| Velocities (m/s) | Area- Weighted Average for Heptane | Mass Flow Rate at outlet (kg/s) | Mass of heptane leaving |
| 2 | 6.902 × 10⁻⁴ | 1.128 × 10⁻¹ | 7.785 × 10⁻⁵ |
| 2 | 4.883 × 10⁻⁴ | 1.692 × 10⁻¹ | 8.262 × 10⁻⁵ |
Reference
“ANSYS Engineering Simulation Solutions for Your Industry.” ANSYS. N.p., 2015. Accessed 3 December 2015. Retrieved from http://www.ansys.com/Industries
“Mixing Application in Food Industries.” Nogrid, 2015. Accessed 3 December 2015. Retrieved from http://www.nogrid.com/application/food-industry/31-mixing-in-food-industry
“Shell Tube Heat Exchanger.” Shell & Tube Heat Exchanger Exporters. Sonitech India private limited, 2010. Web. 3 December 2015. Retrieved from http://www.sonitechindia.com/products.htm
Xia Bin, and Da Wen Sun. “Applications of Computational Fluid Dynamics (CFD) in the Food Industry: A Review.” Computers and Electronics in Agriculture 34 (2002): 7+. Elsevier. Department of Agriculture, Food and Engineering, 2002. Web. 29 Nov. 2015.
Appendix
Physical properties of air at 23.3°C
Density of air = 1.192kg/m3
Hydraulic diameter = 0.12m
Dynamic viscosity = 1.8032 × 10⁻⁵
